
How to lose 170k in 95 minutes
The love(?) story of a Market Maker and one NHL parlay...


On March 12th, the Delphi team spent an evening going through the previous twenty-two days of Kalshi combo parlay data, over 1.28 million executed trades and $69 million in premium, trying to understand what kind of business Kalshi has been cooking up. In these twenty-two days, market-makers on Kalshi’s combo book collected $2.44 million in net margin against $69 million in premium.
A sportsbook’s parlay vig is around 15% in states like New Jersey, so Kalshi’s pricing is quite the boon for retail traders with the weighted maker margin around 3.53% (calculated from the figures in the previous paragraph). Kalshi’s edge is in the leg-level pricing, so when the leg events are multiplied, the compounding tilts into the maker’s favor by a few percent. And, unsurprisingly, 72% of the identifiable takers in our window lost money across their activity in Kalshi during this period.
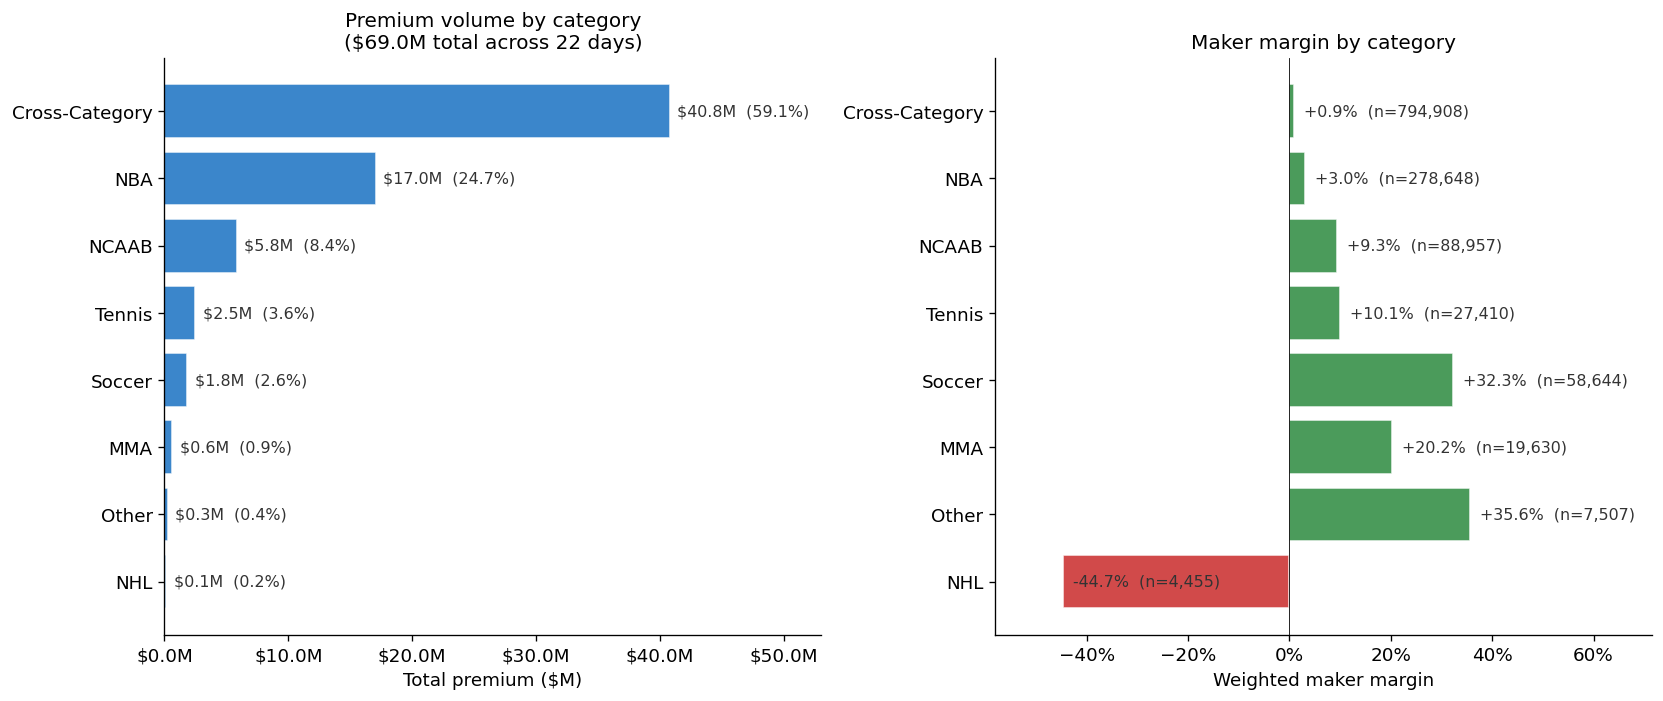
Almost every single sport category was profitable for market-makers across those twenty-two days we investigated, except for NHL parlays, which cost the makers roughly 9% of their premium. As I was looking into the data, I found that most NHL parlays were profitable for makers, except for four-leg parlays. Four-leg parlays were running a NUTTY -96% margin on $191,000 of premium.
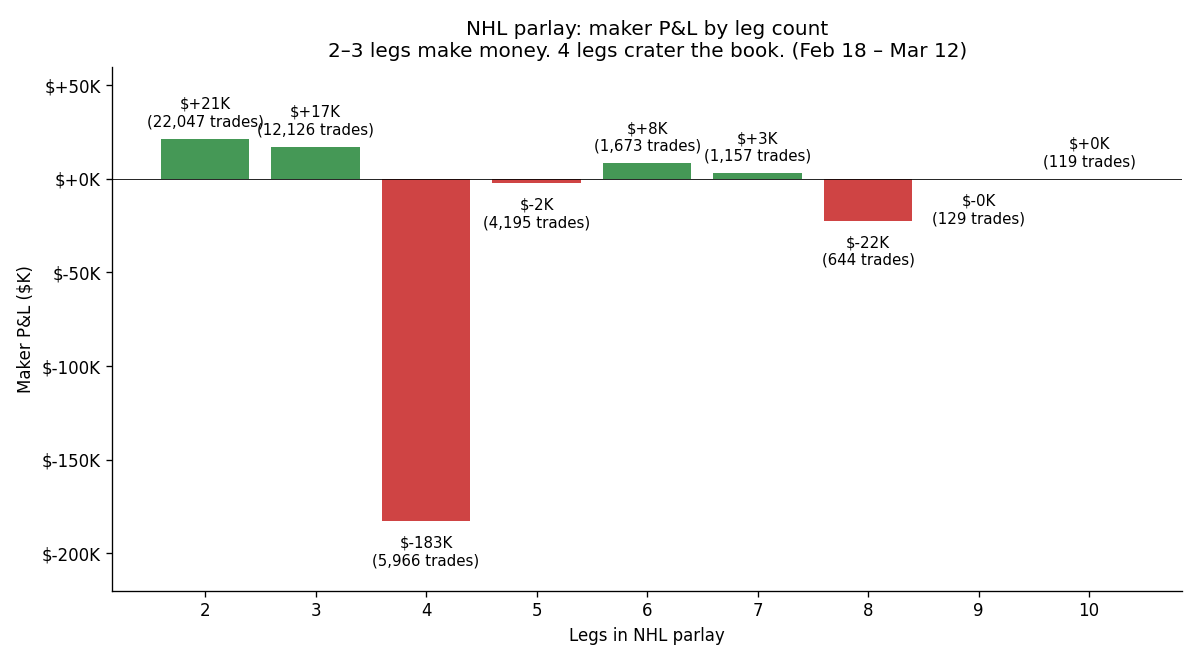
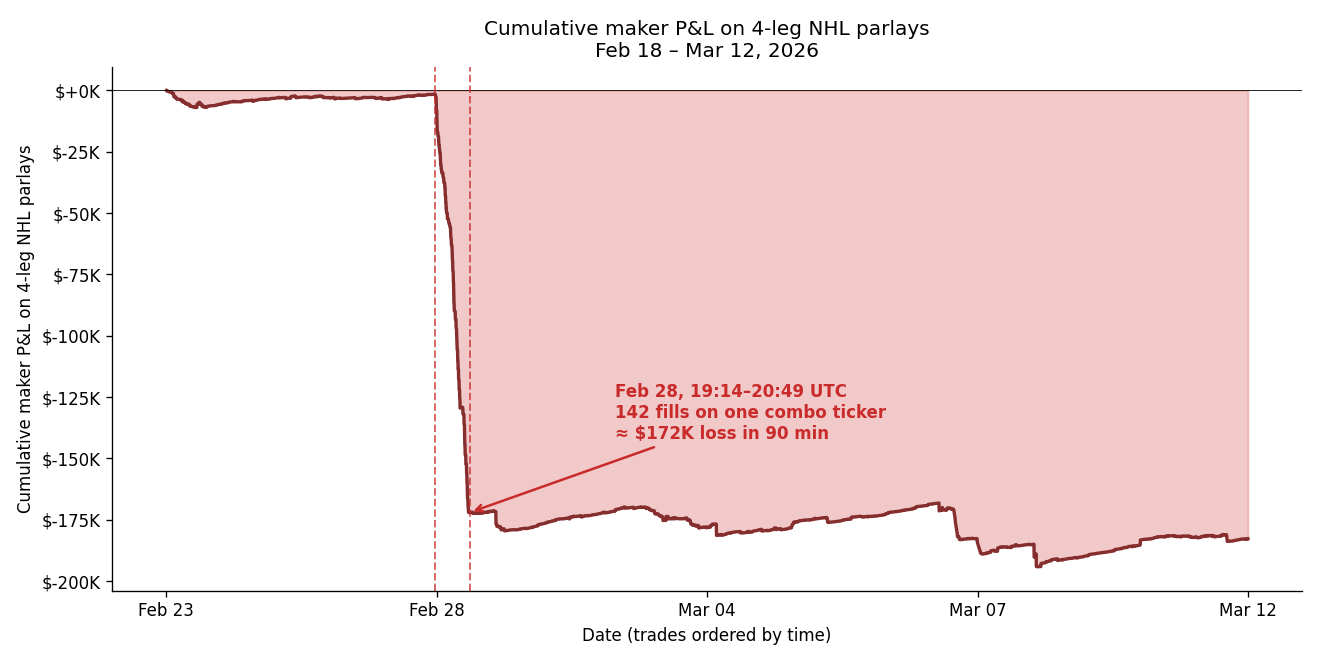
There was something fishy going on, so I dug a little deeper into which specific four-leg NHL combos lost the money. Of the $183,000 that market-makers lost on four-leg NHL parlays across the twenty-two days, $171,000, about ninety-four percent of the losses, came from a single ticker.
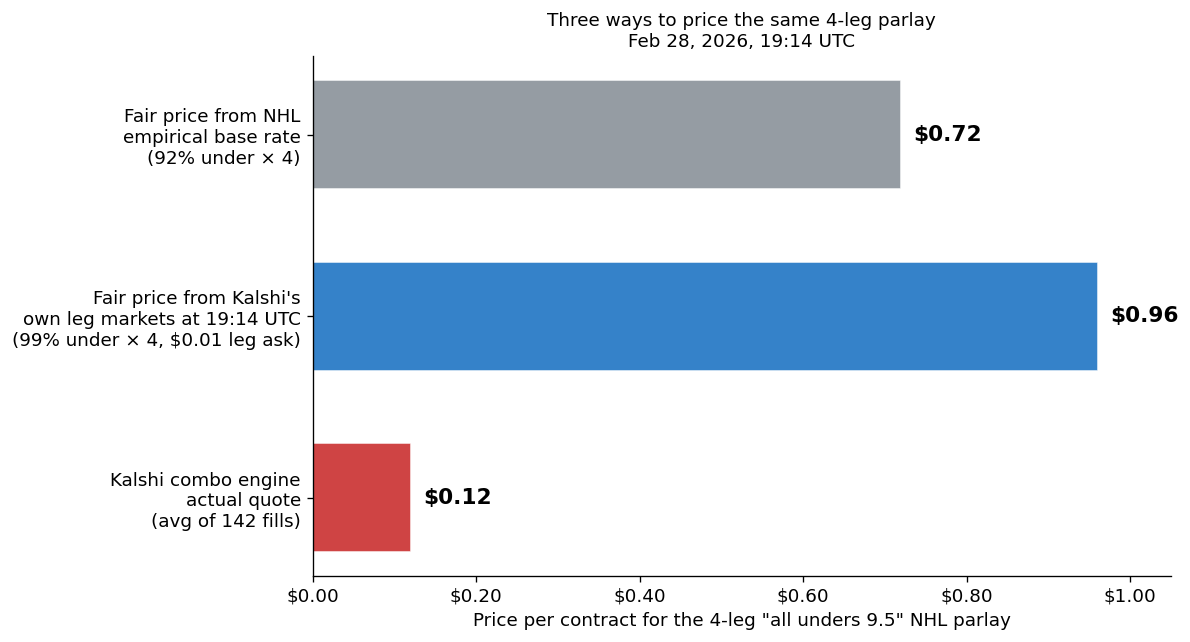
This ticker traded for only ninety-five minutes. It opened for fills on Saturday, February 28, 2026 at about 2:14 PM on the Eastern seaboard. And in the ninety-five minutes of its lifetime, it took 142 fills. The fills landed in sizes between thirty-nine and seven hundred twenty contracts, almost all of them at a price of ten to fifteen cents per contract, with 90 of the 142 at ten cents exactly. When the ticker’s games finished on the following Monday night, the combo paid out $1.00 per contract for 201,921 contracts. The maker had collected $25,530 in premium. The maker paid out $201,921.
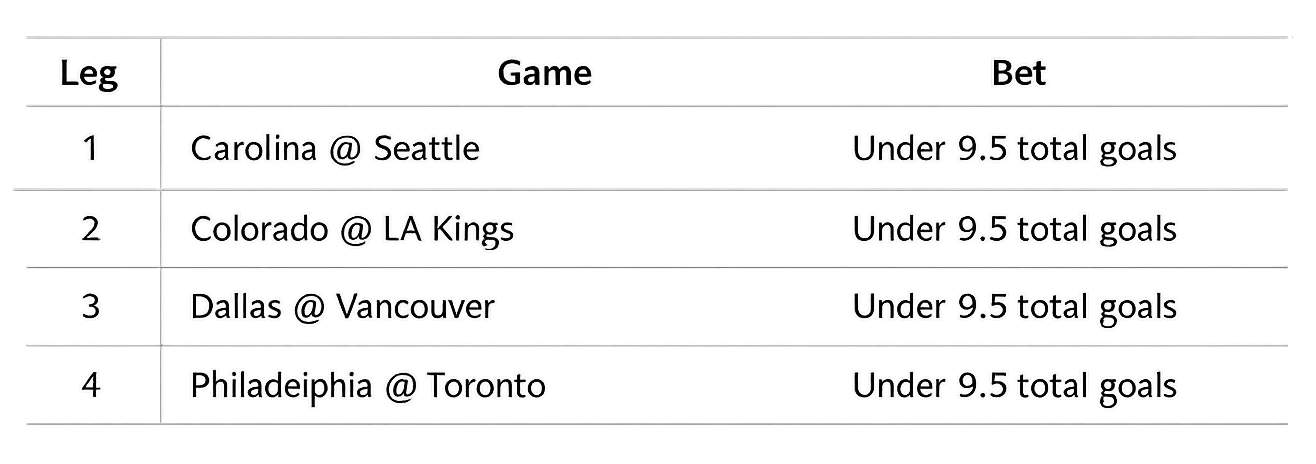
The NHL averages about 6.2 combined goals per game, so 9.5 is a ridiculously high line. By rough league base rate, each “under 9.5” happens something like 90% of the time. Four of them on the same night, assuming independence, comes out to `0.90⁴ = 0.66`. Even accounting for correlation goal totals on a given night move together for all sorts of mundane reasons, from officiating style to post-Olympic conditioning to how often teams are playing on the second night of a back-to-back, the fair combo price was probably a little higher than that, so maybe $0.70-$0.85.
All the while, some market maker’s combo engine was selling it for a ridiculous $0.10.
The fills are quite intriguing. Looking at the timestamps: 19:14, 19:16, 19:45, 19:55, 19:59, 19:59 (a second order in the same second), 20:00, 20:04, 20:09, 20:13, 20:14, 20:14, 20:15, 20:18, 20:43 (three orders inside that minute), 20:44 (two inside that minute), 20:45, 20:47, 20:48, 20:49. All of the trade sizes are clustered: $500, $628, $720, $720 again, $720 yet again. For ninety-five minutes straight, the maker’s automated requoter kept re-posting the same size at the same price after each fill and whoever was on the other side kept lifting it.
The part that confused me at first was that the market actually priced each of the four underlying leg markets correctly. If you look up the individual over/under markets for those four games in Delphi Market’s historical API, each “over 9.5” contract is pinned one to five cents meaning the underlying leg markets had those games as heavy unders and priced them accordingly. But for some reason, a market maker happened to have a wildly wrong one.
I do not know the name of the market-maker nor the successful counterparty. It is still intriguing to observe these patterns happening over the RFQ data and to watch on the sidelines in this black box battle between the takers and the makers and speculate about what might be going on inside. My bet is that it had something to do with hockey resuming after the winter olympics hiatus. Whether there was a genuine technical glitch with a model or the traders at SIG and Jump were just sitting around their trading desks twiddling their thumbs during this period, we will never know…
Thanks for sharing! how do you identify market maker accounts? And wasn't this a arb between Kalshi and poly market?
Great stuff. Is the $2.44 million in net margin accounting for maker fees?